Annotations and Measurements Overview
Introduction
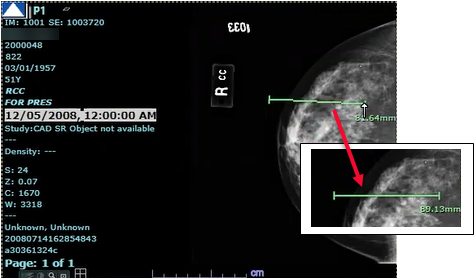
Synapse offers several options for image annotations such as angle, ruler, CTR, text, and ROI (Region Of Interest). An image can have multiple annotations; you can access the annotation options from the context menu.
- You can change the color and size of the annotations.
- You can decide what measurements Synapse displays when you add an annotation to an image. See Manipulating Annotations.
- Annotations are copied between views that display the same image (same SOP instance UID).
- When adding ruler or angle annotations, the line will display in staggered stair-steps to help guide the user place the endpoint in a true horizontal or vertical position (on the exact same X- or Y- axis value) to create a straight line.
-
Measurement Accuracy
The accuracy of the measurements depends on the accuracy of information coming from the modality. The measurement feature calculates line length, angle, area, perimeter, and other statistics using the modality provided information, therefore relying on the original imaging modality for accuracy.
ROI Measurement Considerations
When you create an ROI annotation, Synapse automatically calculates average density of the ROI annotation. The resultant calculations use the pixel values of the displayed image. If the displayed image is Wavelet (lossy) compressed, the pixel values within a ROI might be different from the pixel values within the same ROI in the original version of that image.
Therefore, the mean and standard deviations of the ROI using the wavelet compressed image are likely to be different from the results calculated if the original image was used. Be aware of these ROI differences. The following indications display when viewing mean and standard deviation values on a wavelet compressed image:
- SD: ? - Indicates the SD value is not reliable
- SD: ~234 or M: ~456 - Indicates the value is approximate and different from the calculation of the original